D3.js Weather Graph
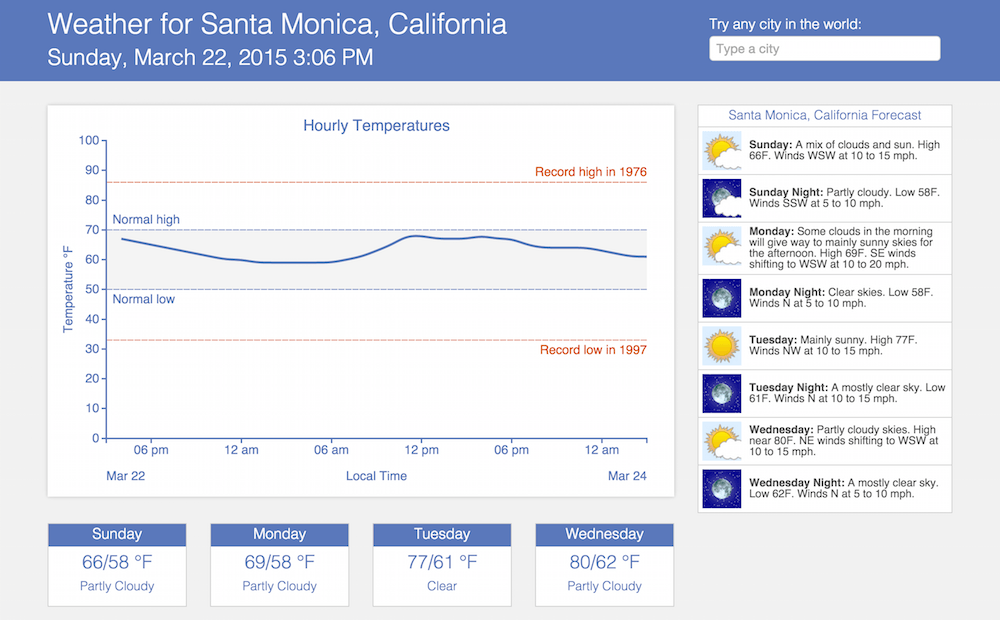
This time-series weather graph was built with D3.js and jQuery. It presents a 36-hour, hourly temperature forecast for the user-specified location. The record high, record low, normal high, and normal low temperatures are all shown for comparison. The local time for the specified location is shown on the x-axis.
Weather Underground’s autocomplete API is used for obtaining location details which are then used to query (WU) for the hourly, three-day, and archived forecasts (in a single request). jQuery is used for the API calls and for the autocomplete effects.